




Predicting real estate prices
Introduction
This is a story from my personal experience of searching for a room in Japan.
At some point in life, especially who lives in a rented house, you dream of finding a place living in your own place. However, while you are searching for a room, you may start asking yourself:
“Is the place still valuable in the future?”
So I reflected on my experience and came up with a solution.
The problem space
Popular real estate websites are mostly search-based UI. e.g. LIFULL Homes Meaning it answers to the question:
“Which rooms meet my criteria?”
Some websites publish the trend of the market, e.g. REINS but in the case of the example, besides, it is unstructured data and not flexible enough to adjust parameters, like what will be the price of the place after 10 years.
At the time then, I made my own calculation.
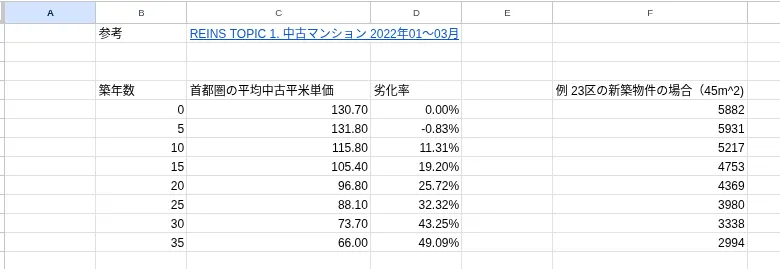
- I used the data from this pdf .
Recalling my question, what are my pain points in the first place?
- Lacks granularity of timeline. User is not able to adjust it.
- Suspicious with data published by major companies because the source of data was unknown.
So I decided to create my own solution (a prototype)!
The solution space
Layout the journey map
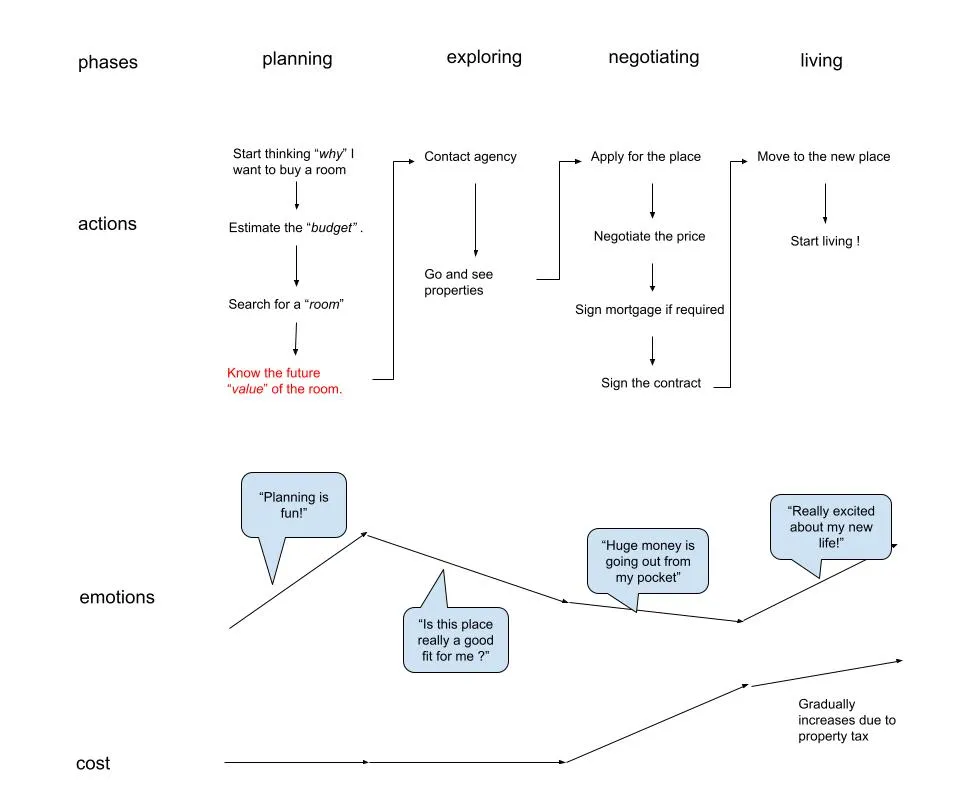
Before I jump into the technical part. I first want to reflect how things proceed using the journey map.
Customer journey map is powerful to get an idea of the behavior of the user.
In my case, the outcome is to understand where in the whole process I am feeling the pain and precisely understand how the treatment fit into the picture.
Since I was only having pain at a certain process, I decided to implement a solution for that pain point.
Architecture
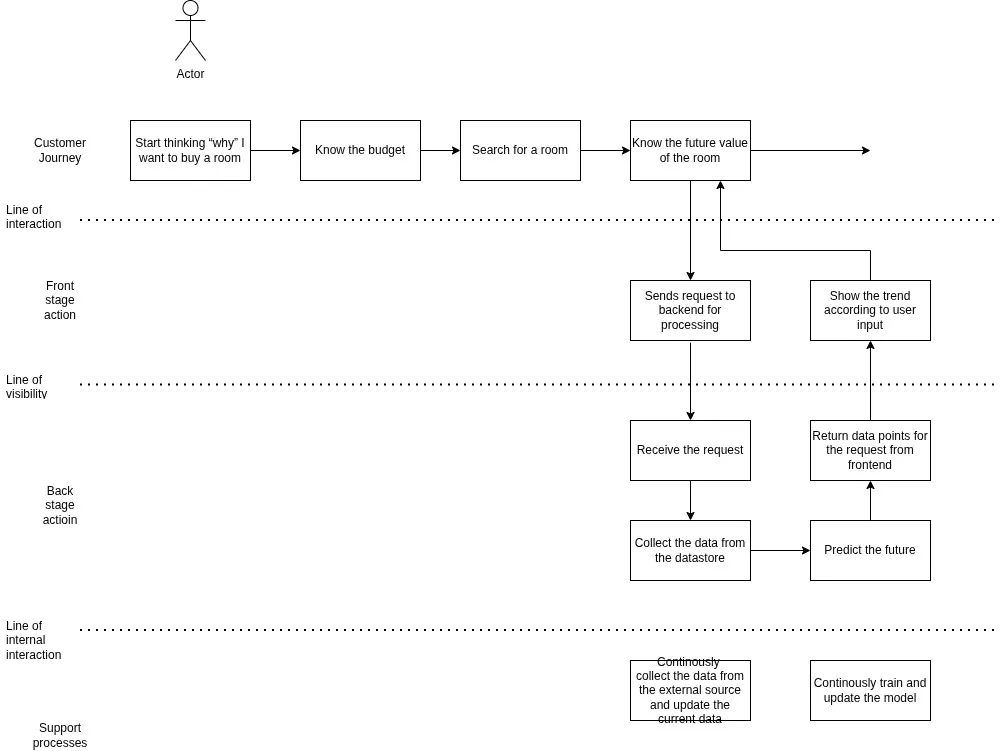
When thinking about the architecture, I wanted to stick to the user perspective, which is the journey map.
So decided to use the tool Service Blueprint to coordinate the processes (See Service Blueprints by IXDF for details).
As you can see from the diagram, Line of internal interaction kind of splits the idea of visualize and data collection and training.
For this story, I would like to focus on data visualization. I will touch into the collection and training on other story.
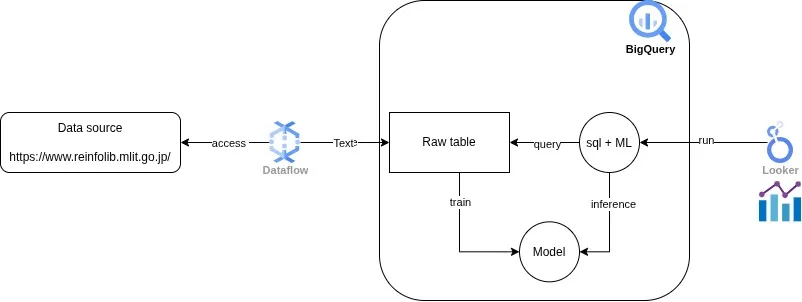
For my use case, I used the google platform to implement the service blueprint.
Inference
For my prototype, I used linear regression to predict the price of the house.
This is because the linear regression is a simple model that can be used to predict the outcome.
The training was done using the BigQuery ML Engine which I will touch into it in another story. I still need to figure out the best features, but I picked the following features:
- District Name(地区名)
- Municipal Name(市区町村名 )
- Prefecture Name(県名 )
- Square Meter (平米)
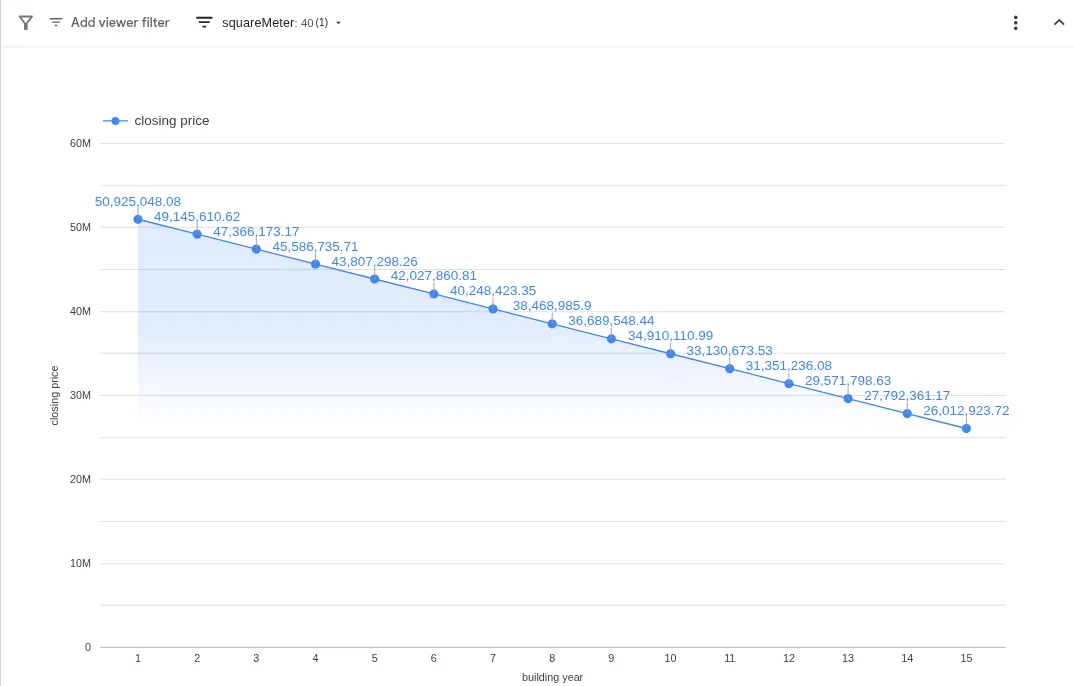
Demo site https://datastudio.google.com/reporting/4074c619-023a-4ced-9d6f-e70bd5e8a3ab
Outcome
According to the sample data, which only has limited records of Tokyo, in below condition the price goes down by 195% in 15 years.
- square meter is 40m^2
- district name is Ogikubo